Beauty Clinic Business
Intelligence Dashboard
End-to-end analytics solution for data-driven decision making
A comprehensive Power BI dashboard analyzing 88M THB revenue across 18 branches, 300+ marketing campaigns, and 15,000 appointments. This project transforms raw data into actionable insights, enabling executives to identify critical business issues and make data-driven decisions with precision.


💡Business Challenge
The Ploblem
A beauty clinic chain with 18 branches needed a unified analytics platform to track performance, identify revenue leakage, and enable data-driven decisions without manual reporting.
📊
Monitor KPIs across finance, customers, marketing, and operations in one place
Track Performance
🎯
Real-time insights for immediate action on critical issues
Enable Quick Decisions
💸
Spot customer churn, no-shows, and underperforming campaigns
Identify Revenue Leakage
⏱️
Eliminate hours of manual Excel reporting with auto-refresh
Save Time
🛠️ Technical Approach
Skills & Tools
Excel
Power BI
DAX
Data Modeling
AI
Data Visualization
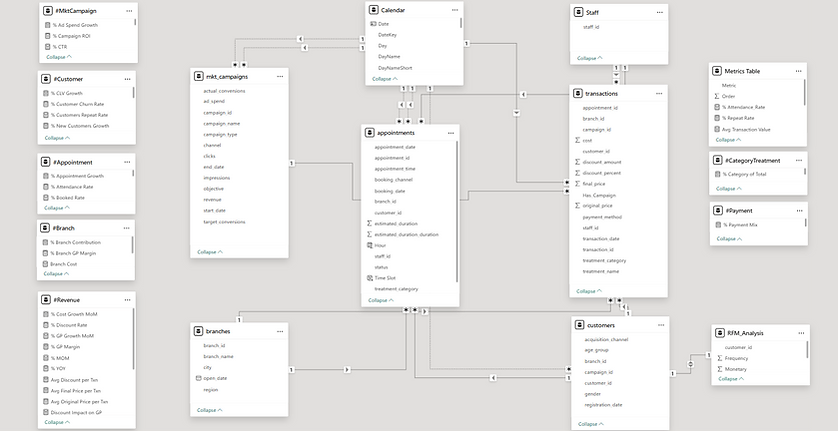
Data Model
Data Volume: 18 branches, 3,500 customers, 12,000 transactions, 15,000 appointments
[Data generated by Claude AI]
Process Flow
1️⃣
-
Date table generation
-
Data cleaning & transformation
ETL (Power Query)
3️⃣
-
Time intelligence (YoY, MoM)
-
RFM segmentation logic
-
Marketing metrics (ROAS, CAC)
-
20+ complex measures
Define Metrics & DAX Calculations
2️⃣
-
Relationship management
-
Calculated columns
Data Modeling
4️⃣
-
5 interactive dashboards
-
Dynamic filtering
-
Mobile-responsive design
-
Easy-to-understand visualizations
Data Visualization
📱Dashboard and Key Insights
For 2025

💰 Key Highlights
-
Total Revenue: 88.14M THB (45.70% increase from last year)
-
2,290 total customers with 498 new customers acquired
-
Strong profitability: 62.59% GP Margin (55.17M THB gross profit)
-
"Slimming Package" is the star performer - generating 2x more revenue than the second-best treatment package!
-
Iconsiam and The Mall Korat are top performers - prime locations deserving special attention
-
Exceptional ROAS of 30.7x - advertising spend delivers outstanding returns
-
Nearly 60% customer retention rate - strong repeat business
🔎Areas for Improvement
-
⚠️ 60.6% Attendance Rate = 4 out of 10 customers don't show up → Implement reminder systems or require deposits
-
📉 Revenue dropped significantly in months 9-10 → Investigate root causes and plan promotional campaigns

💰 Key Highlights
-
Exceptional 62.59% profit margin - the business is in excellent financial health
-
Strong cost control - expenses remain stable regardless of revenue fluctuations
-
Well-balanced revenue distribution - no over-reliance on any single branch
-
Equal payment method usage (~19-21% per channel) - the clinic accommodates all customer preferences
-
Controlled discount rate at 5.43% - maintaining balance between customer incentives and profit margins
-
Package and Thread treatments category dominate - generating over half of total revenue (~55M THB)
🔎Areas for Improvement
-
📉 Some treatment categories show declining revenue (visible in Decrease Bar) - need to identify which treatments and understand why
-
⚠️ 5M THB in total discounts is substantial - some promotions may not be cost-effective and should be reviewed
-
🧪Average transaction: 18,282 THB with 993 THB discount (5.4%) - Consider testing 7-10% discount rates to boost sales volume, or maintain current 5% cap to protect profit margins

💰 Key Highlights
-
2,292 total customers with 498 new customers acquired in 2025
-
Strong 59.73% repeat rate - customers are satisfied and coming back
-
High CLV of 71,728 THB - each customer generates significant value
-
Facebook/Google Ads performing exceptionally well
-
The business has strong potential, but must prioritize customer retention over acquisition. Retaining existing customers costs less and delivers much higher Customer Lifetime Value.
🚨 Urgent Issues
-
35-52% of customers at risk of churning (At Risk + At Risk VIP segments)
-
25.91% churn rate - losing 1 in 4 customers
📋 Immediate Actions (Next 30 Days)
-
Reach out to every At Risk VIP - offer exclusive promotions or gifts
-
Launch re-engagement campaigns - send targeted discounts to At Risk customers
-
Create a loyalty program for Potential Loyalists
-
Follow-up calls before day 51 - win back customers before they're lost
🎯 Expected Results
-
Reduce churn rate
-
Increase revenue without acquiring new customers
-
Boost Customer Lifetime Value
💰 Key Highlights
-
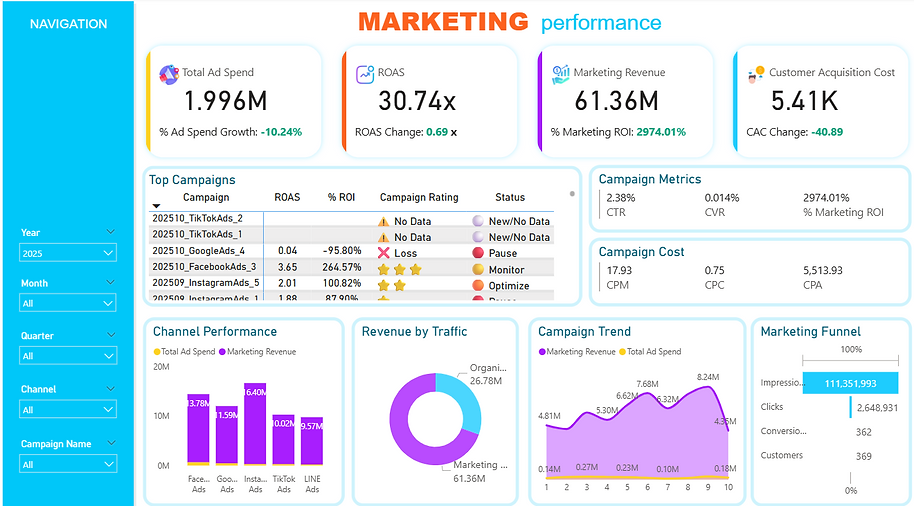
ROAS of 30.74x - exceptional performance compared to beauty clinic industry standards
-
Marketing ROI of 2,974% - every 1 THB spent on ads generates 29.74 THB in revenue
-
CTR of 2.38% - excellent rate indicating compelling ads and precise targeting
-
Customer Acquisition Cost (CAC) 5,410 THB vs CLV 71,728 THB - 13.26x return on investment
-
All channels profitable - no losing channels (except a few specific campaigns)
-
Instagram is the top revenue driver (16.40M THB)
-
Instagram Ads performing strongly - multiple campaigns achieving 10x+ ROAS
-
Ad spend efficiency remains high - costs haven't increased proportionally with revenue growth
🔎 Areas for Improvement
-
CVR of 0.014% is extremely low! This is the main issue
-
Need to optimize Landing Page, Offer, and User Journey
-
-
Heavy reliance on Paid Ads (70%) - if advertising stops, revenue drops significantly
-
Organic traffic at 30.4% is decent but should be developed further (SEO, Word of Mouth)
-
-
Some campaigns losing heavily (Google Ads -95.80%) - should be paused immediately

💰 Key Highlights
-
Attendance Rate of 60.56% - decent rate with 6 out of 10 customers showing up for their appointments
-
Average service time of 62.3 minutes - efficient appointment management
-
Diverse booking channels - customers can book through 6 different channels (Phone, Walk-in, Website, Facebook, LINE, Mobile App) with balanced usage (~16-18% each)
-
Clear peak hours identified - busiest times are 9-10 AM (opening hours), 11 AM-12 PM Thu-Sat, 2-3 PM Thu-Fri, and 7 PM Mon-Fri (after work)
-
Strong staff performance - top performers generating 12-14K THB per appointment
🔎 Areas for Improvement
-
9.60% No-Show Rate is critically high!
-
678 missed appointments = ~11.7M THB lost revenue (calculated from Avg Transaction 17,290 THB × 678 No-Show appointments)
-
Need deposit system and automated reminders immediately
-
-
Extremely low branch utilization (6-9%) - branches are operating at only 6-9% capacity, meaning 90-94% of resources are unused
-
High fixed costs (rent, staff, utilities) with minimal returns
-
Need to either increase appointments or close/consolidate underperforming branches
-
-
Uneven staff workload - some staff handle 156 appointments while others only 97, creating efficiency gaps
Conclusion
💰 Key Highlights
🚀 Business Growth
-
Revenue: 88.14M THB (+45.70% YoY) - strong growth trajectory
-
Gross Profit Margin: 62.59% - exceptional profitability and excellent business health
-
Customer base: 2,292 (498 new customers, 1,369 repeat customers)
📢 Marketing Excellence
-
ROAS: 30.74x - outstanding returns (spend 1 THB, generate 30.74 THB)
-
Marketing ROI: 2,974% - highly effective marketing campaigns
-
CTR: 2.38% - ads are highly engaging and attention-grabbing
👥 Customer Value
-
Customer Lifetime Value: 71,728 THB - high-value customer base
-
CAC 5,410 THB vs CLV 71,728 THB = ROI 13.26x - excellent customer acquisition efficiency
-
Repeat Rate: 59.73% - nearly 6 out of 10 customers return for additional services
🏆 Performance
-
All 18 branches profitable with consistent GP Margin (~62-63%)
-
Top 5 treatments generate 54M THB (61% of total revenue)
-
Slimming Package is the top performer (23M THB) - 2x more than second-ranked treatment
🔎 Areas for Improvement
1. Customer Retention Crisis (URGENT!)
Problem:
-
35-52% of customers at risk of churning (At Risk + At Risk VIP segments)
-
Churn Rate: 25.91% (losing 1 in 4 customers)
Impact: Potential revenue loss
Solutions:
-
Contact At Risk VIP customers immediately with special gifts
-
Launch re-engagement campaigns (discount offers)
-
Create loyalty program (membership/points system)
-
Follow-up calls before day 51
2. Extremely Low Conversion Rate
Problem:
-
CVR only 0.014% (out of 10,000 clicks, only 1-2 convert)
-
111M Impressions → 2.6M Clicks → only 362 Conversions
-
Despite good CTR (2.38%), Landing Page/Offer needs improvement
Impact: Missing out on thousands of potential customers
Solutions:
-
Improve Landing Page (UX/UI, copy, social proof)
-
Simplify booking process (One-Click Booking)
-
A/B test multiple versions
-
Add urgency elements (limited offers, countdown timers)
3. Branch Underutilization (Only 10% Capacity Used)
Problem:
-
All branches operating at only 6-9% capacity (90-94% unused)
-
No-Show Rate: 9.60% (678 appointments) ≈ 11.7M THB lost opportunity
-
Attendance Rate only 60.56% (out of 10 appointments, only 6 show up)
Impact: High fixed costs (rent, utilities, staff) with minimal returns
Solutions:
-
Fix No-Show: Require 30-50% deposit + reminder system (SMS/LINE)
-
Optimize Resources: Close/consolidate unprofitable branches or reduce staff
-
Dynamic Pricing: Regular pricing during peak hours, discounts during off-peak
4. Low Organic Revenue
Problem:
-
Heavy reliance on Paid Ads: 70% (61.36M out of 88.14M)
-
Organic only 30.4% (26.78M)
-
If advertising stops, revenue will drop significantly
Impact: High advertising costs, unsustainable long-term
Solutions:
-
Improve SEO (Google Search rankings)
-
Content Marketing (Blog, YouTube)
-
Referral Program (refer friends for discounts)
-
Organic Social Media Growth
🏆Key Achievements
What This Dashboard Enables
👔 For Executives
-
Real-time visibility into business health across 5 dimensions
-
Data-driven decisions with clear insights and recommendations
-
Revenue optimization by identifying leakage points
⚙️ For Operations
-
No more manual reporting - auto-refresh with new data
-
Consistent metrics across all departments
-
Accessible anywhere via Power BI Service/Mobile
📢 For Marketing
-
Campaign performance tracking with instant ROI
-
Budget optimization by channel and creative
-
Clear attribution from impression to customer
What I Learned
💻 Technical Skills
-
Power BI (Advanced visualizations, drill-through)
-
DAX (20+ complex measures, time intelligence)
-
Power Query (ETL, M language)
-
Data Modeling
-
Data Visualization (Storytelling, UX/UI)
📊 Analytics Skills
-
RFM Segmentation
-
Funnel Analysis
-
Marketing Attribution
-
Statistical Analysis
-
Predictive Insight
💼 Business Skills
-
KPI Definition & Metric Selection
-
Problem Solving & Root Cause Analysis
-
Strategic Thinking
-
Data Storytelling
🎨 Design Skills
-
Dashboard UX/UI Design
-
Color Theory & Accessibility
-
Responsive Design
-
User-Centric Thinking
🎥 Dashboard Demo
💬 Thank You for Exploring This Project!
I hope this dashboard demonstrates my passion for transforming complex data into clear, actionable insights. Every metric, visualization, and recommendation in this project was designed with one goal: driving real business impact.
If you're looking for someone who can turn your data into strategic advantage, I'd love to hear about your challenges and discuss how we can work together.
Let's Connect:
-
📧 Email: standasdp@gmail.com
-
💼 LinkedIn: Warangkhana Duangpaen